Which metrics should be used to monitor an AI app after launch
By Jeremy Ryan, Founder & CEO · November 2026
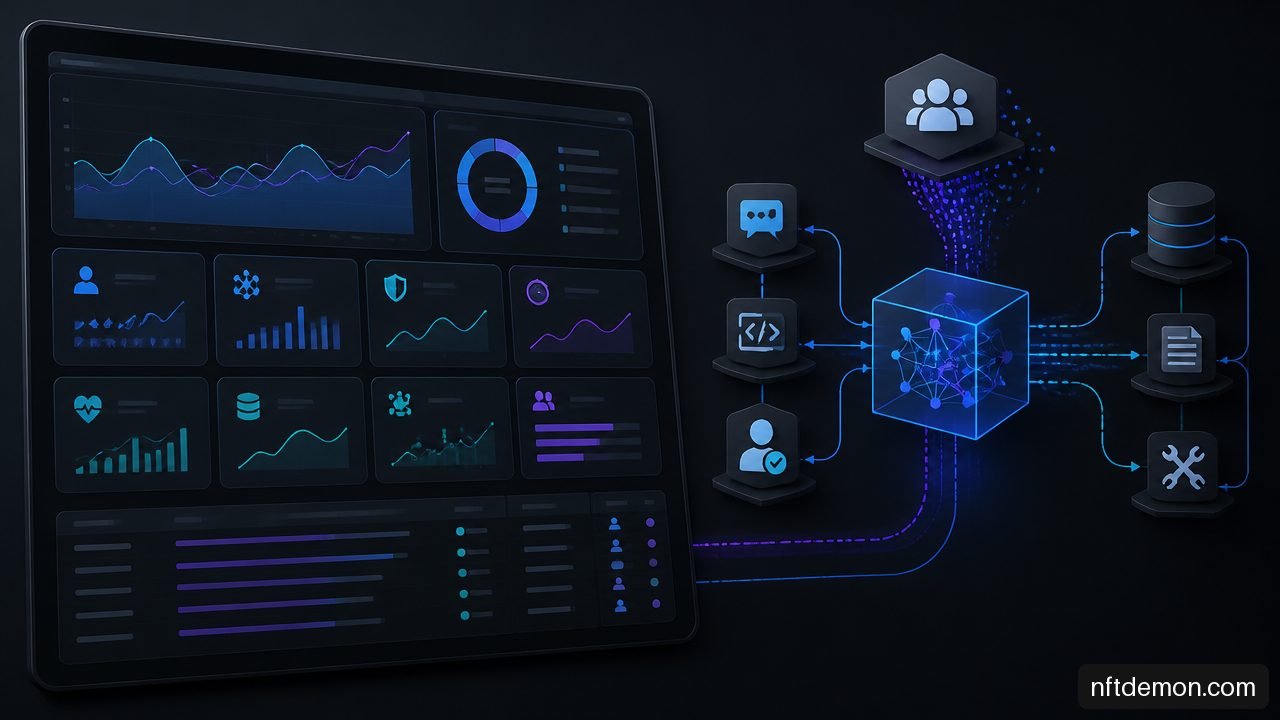
Which metrics should be used to monitor an AI application after launch? The short answer is: measure outcomes, quality, safety, reliability, cost, and user trust together. A dashboard that tracks only model accuracy or token spend can look healthy while users receive unsupported answers, workflows fail midway, or staff quietly override automated decisions.
I recommend treating post-launch monitoring as an operating system for the entire AI workflow. The model matters, but so do retrieval, prompts, policy controls, tools, human review, infrastructure, and the business process the application is supposed to improve.
• Measure Quality And Task Completion
• Monitor Reliability Cost And Workflow Health
• Track Safety Drift And User Trust
Build A Metric Hierarchy
A useful monitoring program starts with a hierarchy rather than a flat checklist. Technical metrics are often leading indicators. User and business outcomes show whether the application is actually delivering value. Neither category can replace the other.
Start With The Intended Decision Or Task
Before selecting metrics, define what a successful task means. For an internal knowledge assistant, success may mean an employee receives a correct, cited answer without opening a support ticket. For a fraud-review copilot, success may mean an analyst reaches a defensible decision faster without increasing false approvals. For an AI agent that updates records, success means the intended change is completed accurately and reversibly.
The definition must be observable. “Helpful response” is too vague to govern a production system. A better definition identifies the completion event, quality criteria, safety boundaries, and accountable human owner.
| Metric Layer | Primary Question | Example Signal | What It Cannot Prove Alone |
|---|---|---|---|
| Business outcome | Did the application create the intended value? | Resolution rate, time saved, conversion, avoided loss | Whether the AI caused the result |
| User outcome | Did the user complete the task successfully? | Task completion, abandonment, repeat use | Whether the output was safe or accurate |
| AI quality | Was the output fit for purpose? | Groundedness, rubric score, reviewer acceptance | Whether systems remained available |
| Workflow health | Did every component work together? | Retrieval success, tool success, action completion | Whether users trusted the result |
| Platform health | Was the service dependable? | p95 latency, uptime, error rate | Whether the experience was useful |
This structure prevents a common failure: optimizing a lower-level metric while damaging the outcome above it. A shorter prompt may reduce cost and latency, for example, but also remove instructions that prevent an agent from taking an unsafe action.
Treat The Application As A Connected System
AI application observability should cover more than model outputs. A plausible answer can still be wrong because the retrieval system found outdated documents. An agent can reason correctly but fail because an API rejected a tool call. A safety filter can block legitimate work at a rate that makes the product unusable.
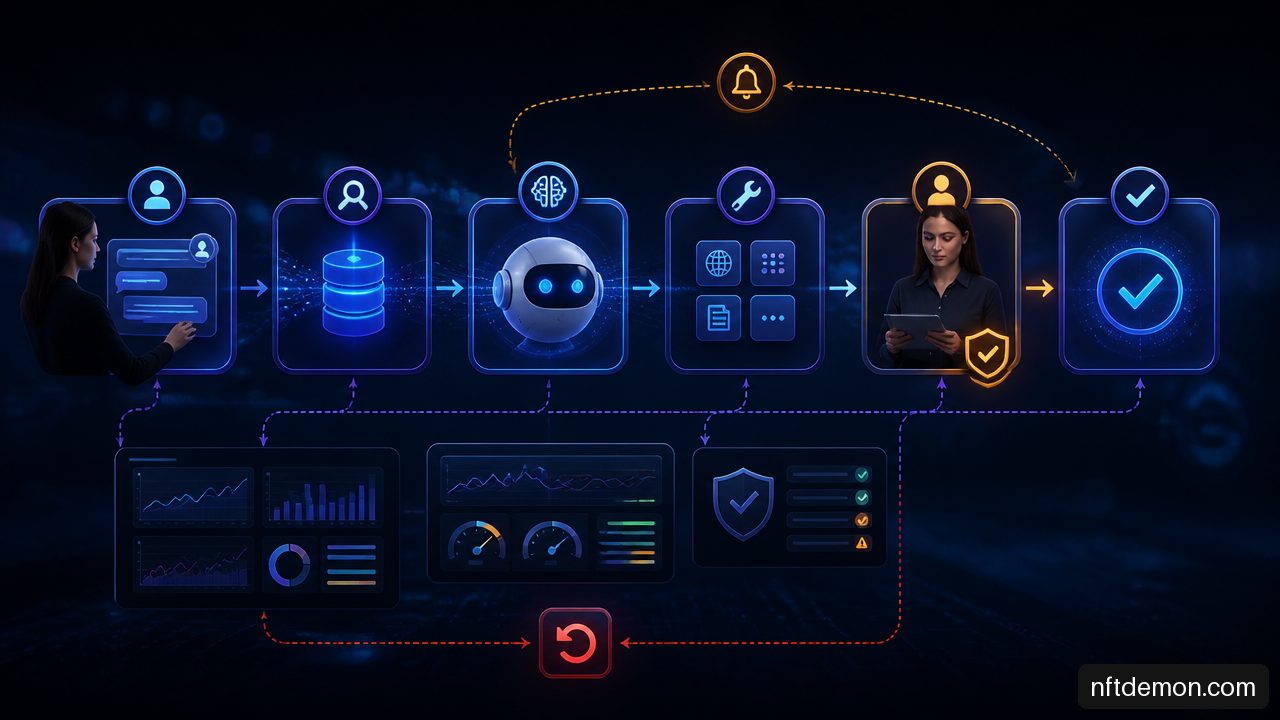
For each request, preserve a trace that connects the user task to the relevant model, prompt template, retrieval sources, tool calls, policy decisions, application version, and final outcome. This is the practical foundation of Audit trail creation for AI systems, especially where a decision may need later explanation, review, or reversal.
A complete trace makes diagnosis possible. Without it, teams tend to blame “the model” for problems caused by stale knowledge bases, broken integrations, or a newly deployed policy rule.
Segment Before You Average
Aggregate averages hide regressions. A 92% acceptance rate may appear strong until it is split by task type and reveals that a high-risk workflow is accepted only 63% of the time. Every core metric should be segmentable by the dimensions that can plausibly change behavior.
At minimum, segment by:
• Model and model version
• Prompt, retrieval, policy, tool, and application version
• User cohort, role, geography where relevant, and permission tier
• Task type, workflow path, language, and input complexity
• Human-reviewed versus fully automated outcomes
Do not segment indiscriminately. Tiny cohorts produce noise, privacy concerns, and dashboards nobody can operate. Start with high-volume or high-consequence workflows, then expand where a discrepancy appears.
Measure Quality And Task Completion
Quality is the center of AI monitoring, but it should not be reduced to a single “accuracy” score. Many generative tasks have no one correct answer. In those cases, evaluate whether the output meets a defined rubric for factual support, relevance, completeness, instruction adherence, and appropriate uncertainty.
Use Outcome-Specific Quality Measures
Choose a quality measure that matches the application’s job. A document summarizer may be evaluated for factual consistency and coverage. A customer service assistant may be evaluated for resolution, policy compliance, and escalation quality. A coding assistant may be evaluated for tests passed, security issues introduced, and developer acceptance.
| Application Type | Core Quality Metrics | Useful Failure Signal |
|---|---|---|
| Retrieval assistant | Groundedness, citation correctness, answer completeness | Unsupported claims despite retrieved context |
| Customer-facing chatbot | Resolution rate, escalation appropriateness, repeat-contact rate | User repeats the same question or abandons chat |
| Decision support tool | Reviewer acceptance, agreement with policy, override rate | Human changes a recommendation |
| AI agent | Tool-call success, action completion, rollback rate | Agent completes steps but leaves the task unfinished |
| Content generation tool | Editorial acceptance, revision depth, policy pass rate | Output requires substantial human rewriting |
For retrieval-augmented generation, measure groundedness separately from fluency. An answer can sound polished while being unsupported by the available source material. Evaluate whether claims are attributable to retrieved content, whether the right content was retrieved, and whether the response acknowledges missing evidence instead of filling gaps with speculation.
This distinction matters for regulated and operational uses. Teams deploying AI-powered compliance tools should monitor whether recommendations follow approved rules and evidence, not merely whether the interface produces coherent explanations.
Combine Production Sampling With Fixed Evaluations
Production monitoring and controlled evaluation answer different questions. Sampled production traffic reveals what real users are asking, including novel inputs and abuse attempts. A fixed evaluation set reveals whether a new model, prompt, retrieval index, or policy change caused a regression under controlled conditions.
Use both. If only production traffic is sampled, traffic mix may change and make a regression difficult to isolate. If only a fixed test set is used, it can become stale and miss emerging user behavior.
There is no universal sampling percentage that fits every application. The appropriate level depends on traffic volume, automation risk, review cost, and the severity of potential harm. A low-risk writing assistant might evaluate a rotating sample plus targeted edge cases. A system making financial, healthcare, legal, employment, or security-adjacent recommendations may require denser sampling, mandatory review for sensitive categories, and more frequent scheduled tests.
A useful rule is simple: increase evaluation intensity when the system can create irreversible, regulated, or difficult-to-detect harm.
Make Human Overrides A First-Class Metric
Users communicate quality through behavior. Track rejection, edit depth, appeal, override, fallback, re-prompt, and manual-completion rates. These metrics often expose trust degradation before users file a formal complaint.
Consider an operations team using an AI system to classify incoming requests. Uptime remains near 100%, latency improves, and total throughput rises. Yet the manual override rate climbs from 8% to 19%. That is not merely a human-review metric. It may indicate that the system is misclassifying a new request type, that a policy changed, or that the AI has become overconfident.
Interpret overrides carefully. A higher override rate could reflect lower quality, but it could also result from a new reviewer group with stricter standards. Segment the result, inspect representative cases, and compare against a pre-change baseline before deciding whether to roll back.
Monitor Reliability Cost And Workflow Health
A technically impressive model is still a failed product if it is slow, unavailable, unaffordable, or unable to complete an end-to-end task. Reliability metrics should explain not only whether a request returned, but whether the workflow reached a valid result.
Track Latency At The Tail, Not Only The Average
Average latency can conceal poor experiences. If most responses arrive in two seconds but a small share take 45 seconds, the average may remain acceptable while affected users abandon the task. Monitor p50, p95, and p99 latency by workflow, model, tool dependency, and user-facing step.
Use response-time objectives that reflect the task. A real-time support assistant needs a different threshold than a background research workflow. Do not set universal numbers without considering user expectations, downstream dependencies, and the value of a more deliberate answer.
Also track:
• Availability and degraded-mode frequency
• Request, parsing, provider, retrieval, policy, and tool error rates
• Queue depth, timeout frequency, and fallback activation
• Time to detect, acknowledge, mitigate, and recover from incidents
For infrastructure-focused systems, AI-driven network optimization requires an additional distinction: an optimization recommendation may be generated successfully while the network outcome remains poor. Monitor the recommendation, the applied action, and the resulting operational state as separate events.
Calculate Cost Per Successful Task
Total monthly spend is necessary for budgeting but weak as an operating metric. It rises naturally when use rises. A more revealing measure is cost per successful task:
Cost per successful task = total execution cost for a workflow ÷ number of tasks completed successfully
Execution cost should include model inference, embeddings, retrieval, tool calls, retries, fallback models, human review attributable to the task, and any third-party services needed to complete it. The denominator should exclude failed, abandoned, reversed, or invalid outcomes according to the success definition established earlier.
A rising cost per successful task is a diagnostic signal. It can indicate longer contexts, repeated retries, a provider fallback, excessive human correction, or an agent loop. An agent might call search, rephrase a query, call search again, and continue until a token limit stops it. Total spend may look normal if traffic is flat, while cost per completed task exposes the deteriorating economics.
Detect Agent Loops And Partial Completion
Agentic systems need state-aware metrics. A response generator can be evaluated at the message level; an agent must be evaluated across a sequence of decisions and actions.
Track these workflow metrics:
| Metric | What It Reveals | Likely Response |
|---|---|---|
| Tool-call success rate | Whether tools execute as intended | Investigate authentication, schemas, and tool selection |
| Action completion rate | Whether the task reaches the expected end state | Inspect handoffs and downstream failures |
| Steps per completed task | Whether the agent is becoming inefficient | Set step budgets or refine planning logic |
| Retry rate | Whether calls are failing or outputs are unusable | Separate transient failures from systematic defects |
| Rollback or reversal rate | Whether actions need correction | Reduce autonomy or require approval |
| Loop termination rate | Whether safeguards stop repetitive behavior | Review termination rules and task decomposition |
Safe failure is often preferable to confident failure. If an agent exceeds its step budget, loses access to a required tool, or encounters conflicting instructions, it should preserve context, explain the limitation, and route the task to a human or controlled fallback rather than improvising an irreversible action.
Track Safety Drift And User Trust
Post-launch risk changes because users, attackers, data sources, policies, and operating conditions change. Monitoring must therefore cover harmful outputs, security signals, distribution shifts, and near-misses, not only confirmed incidents.
Measure Safety At The Output And Action Level
Safety metrics should map to the system’s actual risk profile. A public chatbot may need measures for harmful content, privacy leakage, prompt injection attempts, refusal quality, and policy violations. An AI agent with access to enterprise tools may also need authorization failures, attempted restricted actions, risky tool sequences, and data-exfiltration indicators.
Measure both false negatives and false positives. A filter that permits unsafe output is a clear issue. A filter that blocks legitimate users at high rates also harms the product and can drive people toward unapproved workarounds.
Track near-misses separately from incidents. A prompt injection attempt that is blocked successfully may not be an incident, but a sharp rise in attempts can justify defensive changes. Likewise, an AI action reversed before impact is still evidence that autonomy boundaries, approval rules, or training data need review.
Separate Data Drift From Concept Drift
Data drift occurs when production inputs differ materially from the baseline used for design or testing. Concept drift occurs when the relationship between inputs and the desired answer changes, even if the input format looks familiar.
For example, a support assistant may receive the same categories of customer questions, but a product policy update changes the correct answer. Input distribution appears stable, while answer quality declines. That is concept drift.
Monitor drift through a combination of input statistics, embedding or feature distributions where appropriate, retrieval corpus freshness, changes in user intents, quality scores, and human feedback. Drift detection alone is not a verdict. A shift may reflect healthy growth into a new market rather than degradation. The required next step is targeted evaluation: inspect the new segment, compare it with the baseline, and decide whether to update data, policies, prompts, models, or routing.
Connect Alerts To Decisions
An alert without an owner and response path is noise. For every critical metric, document a threshold, responsible role, triage evidence, and permitted actions. Thresholds should be based on baseline behavior and business tolerance rather than copied from another company’s dashboard.
| Trigger | Immediate Action | Escalation Decision |
|---|---|---|
| Sharp quality-score decline after release | Freeze further rollout and compare versions | Roll back if regression is confirmed |
| Safety-policy violation above tolerance | Disable affected capability or route to review | Conduct incident assessment and red-team follow-up |
| Tool failure surge | Switch to safe fallback and preserve task state | Repair integration before restoring automation |
| Override-rate increase in high-risk workflow | Require human approval for affected segment | Reassess model, policy, and training data |
| Cost per successful task spike | Cap retries and inspect traces for loops | Change routing, context limits, or agent logic |
The goal is not to eliminate every anomaly. It is to make the system behave predictably when anomalies occur, with evidence sufficient to decide whether to continue, constrain, correct, or retire a capability.
Key Takeaways
• Monitor the complete AI application, including models, prompts, retrieval, tools, policies, infrastructure, and human review.
• Define success before launch, then measure task completion and business outcomes alongside technical performance.
• Use quality measures that fit the task. For generative systems, groundedness, rubric-based review, acceptance, and escalation quality are often more useful than a single accuracy number.
• Track p95 and p99 latency, categorized errors, uptime, fallback use, and workflow completion rather than relying on average response time.
• Calculate cost per successful task, not only total spend. It exposes retries, long contexts, failed actions, loops, and expensive human correction.
• Treat overrides, appeals, edits, re-prompts, and fallbacks as evidence about trust and workflow quality.
• Evaluate sampled production traffic and fixed test sets together. One detects live behavior; the other makes regressions easier to isolate.
• Every alert needs an owner, response action, and clear decision point for rollback, human escalation, safe fallback, or further investigation.
Frequently Asked Questions
Which Metrics Are Essential After An AI Application Launch?
Start with task completion, output quality, user acceptance, safety violations, p95 and p99 latency, availability, categorized errors, cost per successful task, drift indicators, tool-call success, and override rate. The exact scorecard should reflect the application’s intended decision, level of automation, and consequence of failure.
How Should Quality Be Measured When There Is No Simple Accuracy Label?
Use a task-specific rubric. Evaluate factual support, relevance, completeness, instruction adherence, safety, and whether the user completed the intended task. Combine automated checks with sampled human review for high-impact or ambiguous outputs. A concise but unsupported answer should not receive the same score as a correct, well-supported answer.
Should Latency Be Measured By Average, p95, Or p99?
Measure all three, but use p95 and p99 to manage user experience and service objectives. The average can remain stable while a meaningful minority of users encounter unacceptable delays. Segment latency by workflow and dependency so teams can identify whether the model, retrieval service, tool, or queue is responsible.
How Can An Organization Detect An AI Agent Loop?
Monitor steps per task, repeated tool calls, retry rate, time spent in a workflow state, token consumption per completion, and loop termination rate. A sudden increase in cost per successful task is often an early warning. Apply step budgets, idempotent actions, explicit stop conditions, and human escalation for unresolved tasks.
What Metrics Show That Users Do Not Trust The AI Application?
Look for rising override, rejection, appeal, manual-completion, re-prompt, edit-depth, abandonment, and fallback rates. These signals require context. A higher override rate may result from a new user group rather than degraded output, so compare segments and inspect representative examples before assigning a cause.
How Often Should Production Outputs Be Evaluated?
Evaluate continuously through sampled traffic, with scheduled evaluations after material changes and at intervals appropriate to the risk level. High-consequence systems require more frequent review and tighter release gates than low-risk drafting tools. There is no defensible universal sampling percentage because traffic volume, failure impact, and review capacity vary substantially.
What Should Trigger Rollback Or Human Escalation?
Trigger rollback or constrained operation when quality declines materially after a release, safety violations exceed the organization’s tolerance, tool failures threaten task integrity, overrides rise in a high-risk segment, or an agent cannot complete a task within defined safety limits. Human escalation is often the better immediate response when the failure is uncertain but potentially consequential.
How Can Monitoring Distinguish A Bad Model From A Bad Workflow?
Use end-to-end traces and version metadata. Compare model output quality with retrieval relevance, source freshness, prompt version, policy decisions, tool-call results, and final task completion. If the model response is sound but the action fails, the defect may be in a tool integration. If retrieval is poor, changing models may not solve the underlying problem.
A mature monitoring program does not chase a single perfect metric. It maintains a connected evidence trail from system health to user outcome, then uses that evidence to improve the AI application without hiding risk behind attractive averages.
NFT Demon Holdings helps enterprises scope, evaluate, and build blockchain programs — start with a free evaluation call.
Talk through your use case
Free evaluation call — objective, constraints, and fit, before any proposal.