How to measure productivity gains from AI workflow automation
By Jeremy Ryan, Founder & CEO · November 2026

Measuring AI workflow automation is not simply a matter of counting hours saved. To understand how to measure productivity gains from AI workflow automation, I recommend tracking whether the system improves completed output, quality, service levels, and business capacity after all human oversight and operating costs are included.
A workflow that closes more tickets but creates downstream rework is not necessarily more productive. Likewise, an automation that saves 500 employee hours but leaves those hours idle has released capacity, not necessarily created financial value. Decision makers need a measurement model that separates these outcomes.
- Define What Productivity Means for the Workflow
- Build a Defensible Baseline Before Automation
- Prove Attribution and Calculate Realized ROI
- Monitor the System After Launch
- Key Takeaways
- Frequently Asked Questions
Define What Productivity Means for the Workflow
Productivity is the amount of acceptable work completed with a given amount of labor, time, and cost. In AI workflow automation, that definition needs one additional safeguard: the work must be completed successfully without moving effort or risk to another team, customer, or stage of the process.
For decision makers, the practical question is not, “Did the AI run?” It is, “Did the workflow produce more valuable, correct outcomes with the same or fewer resources?”
Measure Output, Speed, Quality, and Cost Together
A credible scorecard uses a balanced group of KPIs rather than a single time saved metric. The right mix depends on the workflow. For example, a customer support workflow should emphasize containment, resolution time, customer outcomes, and reopening. A finance workflow may prioritize exception rates, approval delays, audit readiness, and cost per transaction.
| Measurement Area | Core Metric | What It Reveals | Common Failure Mode |
|---|---|---|---|
| Output | Completed units per week or employee | Whether more work is getting done | Counting partially completed work as finished |
| Speed | End to end cycle time | Whether requests move faster from intake to completion | Measuring only active handling time |
| Quality | Acceptance, defect, rework, or escalation rate | Whether faster work remains usable | Ignoring downstream corrections |
| Service | SLA attainment and backlog age | Whether users experience better service | Hiding delays in queues or handoffs |
| Economics | Cost per completed unit | Whether operational efficiency improved | Excluding AI oversight and maintenance costs |
| Capacity | Productive use of released time | Whether saved time becomes business value | Treating nominal hours as immediate savings |
For IT service workflows, Moveworks identifies containment, resolution time, first contact resolution, SLA attainment, reopening, and escalation as useful operational metrics. Those metrics matter because a bot that closes requests quickly but causes users to reopen them has created apparent speed, not reliable productivity.
Use Quality Adjusted Throughput
A useful management metric is quality adjusted throughput. This is not a universal accounting standard, but it provides a practical guardrail against inflated productivity claims.
One way to calculate it is:
Quality Adjusted Throughput = Completed Units × Acceptance Rate × (1 − Rework Rate)
Consider an invoice review team. Before automation, it completes 1,000 invoices per week with a 98% acceptance rate and a 2% rework rate. After AI automation, it completes 1,250 invoices, but acceptance falls to 92% and rework rises to 8%.
The raw throughput increase is 25%. The quality adjusted result is smaller:
• Baseline: 1,000 × 0.98 × 0.98 = 960 quality adjusted units
• Post automation: 1,250 × 0.92 × 0.92 = 1,058 quality adjusted units
The operational improvement is closer to 10% than 25%. That is still valuable, but it changes the investment case and highlights a quality issue that requires attention.
Define “Successful Automation” Before Reporting Automation Rate
Automation rate is often calculated as fully AI resolved requests divided by total requests. That metric is useful only if the organization defines what “fully resolved” means.
A completed case should generally meet all relevant conditions:
• The requested action was actually completed.
• Required records, approvals, or audit evidence were created.
• No hidden human intervention was needed outside the logged workflow.
• The customer, employee, or downstream system did not reopen or reverse the outcome.
• The result met applicable quality, security, and compliance requirements.
Without these conditions, automation rate can become a dashboard vanity metric. A support assistant that deflects users to documentation may technically avoid escalation, yet still fail to solve the underlying request.
For organizations connecting AI automation to distributed systems or operational infrastructure, AI-driven network optimization provides a related view of measuring optimization within a controlled operating model.
Build a Defensible Baseline Before Automation
The baseline is the performance level that AI automation is expected to improve. If it is incomplete, inconsistent, or too short, the eventual ROI calculation becomes difficult to defend.
I recommend defining the workflow boundary first. Identify where the work starts, what counts as completion, which teams participate, and which exceptions belong inside the measurement scope. This prevents a common problem: the automated step looks faster while the full process remains unchanged because work simply waits longer elsewhere.
Capture End To End Workflow Performance
Track both active work time and elapsed cycle time. Active work time measures hands on effort. Cycle time measures the period from request intake through final completion, including queue time, approvals, handoffs, and system delays.
Larridin’s workflow measurement guidance emphasizes end to end cycle time, handoff delay, and rework rate. This distinction matters in workflows with several teams. AI may reduce a reviewer’s handling time from 20 minutes to five minutes, but the customer sees no improvement if approval still sits in a queue for two days.
A practical baseline dataset should include:
• Workflow volume by day, week, and request category.
• Median and percentile cycle time, not only averages.
• Active handling time where reliable time records exist.
• Handoff count, queue duration, and exception path frequency.
• Error, rework, reopening, and escalation rates.
• Staffing levels, overtime, contractor use, and workload mix.
• Cost per completed transaction or case.
Medians and percentiles are especially useful when a small number of highly complex cases distort averages. For example, a median resolution time may decline even while the slowest 10% of cases become harder to resolve. That pattern can signal that automation is correctly handling routine work but leaving specialists with a more complex residual queue.
Choose a Baseline Period That Reflects Normal Work
Historical data from three to six months can provide a useful starting point for operational measurement. Moveworks recommends using approximately three to six months of historical operational data for baseline and post implementation comparisons, including time saved, throughput, and automation rate calculations.
That period is not a universal rule. A payroll workflow may require comparison across monthly and quarterly cycles. A retail support workflow may need seasonal data. A security operations workflow may need separate treatment for incident spikes, because an unusually quiet month can make any automation look effective.
When historical data is weak, use a shorter prospective baseline period but document the limitation. For example, if a new procurement process has only six weeks of reliable data, report the observed trend with caution rather than claiming a precise annualized ROI figure.
Segment the Work Before Comparing It
Aggregate averages can conceal meaningful differences. AI automation often performs best on repetitive, high volume, well structured requests. It may offer little benefit, or introduce greater review burden, on rare, ambiguous, or high consequence cases.
Segment results by factors such as:
• Request type or transaction category.
• Complexity tier.
• Customer or business unit.
• Worker experience level.
• Channel, language, or data source.
• Exception versus standard processing path.
This is where process mining and event log analysis can help. Instead of relying entirely on self reported task time, event logs can reconstruct actual handoffs, waits, loops, and rework paths. The goal is not to create surveillance metrics. It is to identify where the workflow truly changes.
Prove Attribution and Calculate Realized ROI
A simple before and after comparison is often insufficient. Volume may change, staff may become more experienced, policies may shift, or demand may decline. Each factor can improve metrics without AI being the primary cause.
Use a Comparison Design That Matches the Decision
The strongest feasible approach is a controlled rollout. Deploy automation to one comparable workflow, team, region, or request category while another group continues with the existing process. Then compare the change in each group over the same period.
This approach is often described as difference in differences. It asks a more useful question than “Did results improve?” It asks, “Did the AI enabled workflow improve more than a comparable workflow affected by the same business conditions?”
| Measurement Design | Best Use Case | Strength | Limitation |
|---|---|---|---|
| Before and after comparison | Stable, low risk workflow | Fast and simple | Vulnerable to seasonality and unrelated changes |
| Staggered rollout | Multiple teams or business units | Enables comparison during deployment | Requires comparable groups |
| Matched request categories | Mixed complexity workflows | Reduces distortion from workload mix | Matching rules require discipline |
| Difference in differences | Material investment decisions | Better attribution than simple pre and post analysis | Can be difficult with limited data |
Suppose an AI assistant is introduced to one support team in April while another team handles similar tickets manually until June. If both teams experience a 10% reduction in ticket volume, but only the AI enabled team improves SLA attainment by 18 percentage points, the comparison is stronger than a standalone pre and post result.
Avoid overengineering this method for a small, low cost pilot. But for a large deployment affecting service commitments, regulated operations, or workforce planning, attribution design should be part of the implementation plan from day one.
Separate Gross Time Saved From Capacity Realization
This is the most important distinction in many AI ROI models.
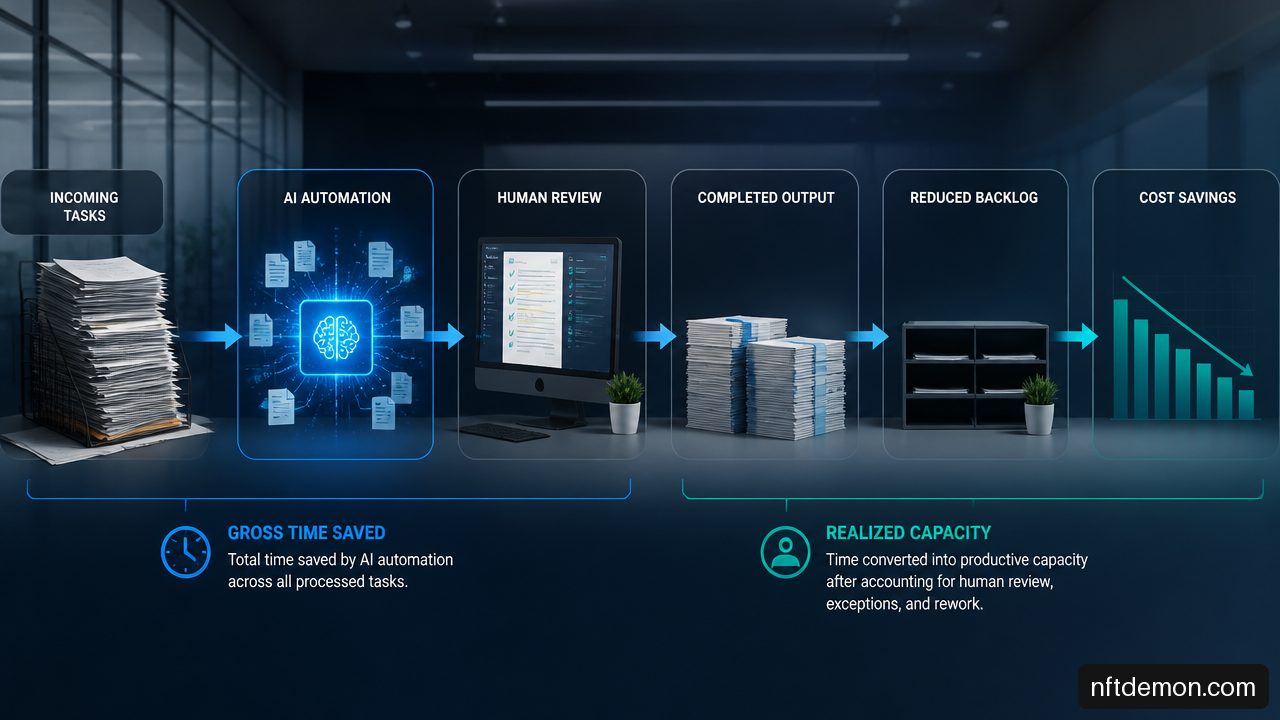
Gross time saved is the reduction in labor time required to complete work. Capacity realization is the portion of that time that becomes additional output, reduced backlog, lower overtime, avoided hiring, faster customer response, or another measurable business outcome.
For example, an AI tool saves a claims team 400 hours per month. That is a meaningful operational result. Yet the financial outcome depends on what happens next:
• If the team handles 15% more claims with the same staff, the released capacity supports additional throughput.
• If backlog declines and customer wait times improve, the value may appear in service performance and retention rather than payroll reduction.
• If overtime falls by 200 hours, the savings are more directly measurable.
• If employees use the time for work that is not measured, the benefit may be real but not readily monetized.
Fair warning: do not label released hours as headcount savings unless positions are actually removed, vacancies remain unfilled, contractor spend falls, or overtime is demonstrably reduced. An FTE equivalent is a capacity estimate, not proof of cost reduction.
For a broader investment measurement perspective, decision makers can compare this logic with how executives measure blockchain ROI, particularly when technology value depends on operational adoption rather than a single technical metric.
Calculate ROI With Full Costs Included
A defensible AI workflow ROI model includes implementation expense and recurring operating cost.
ROI = (Realized Annual Benefit − Total Annual Cost) ÷ Total Annual Cost × 100
Total annual cost should include:
• Software, model, infrastructure, and integration expenses.
• Internal implementation labor and process redesign.
• Training, change management, and documentation.
• Human review, exception handling, and escalation work.
• Prompt, workflow, and knowledge base maintenance.
• Monitoring, security review, compliance controls, and incident response.
• Rework, remediation, or customer recovery costs caused by errors.
A workflow can increase throughput while failing to reduce cost because demand rises, fixed staffing remains unchanged, or human review expands. That is not automatically a failed deployment. It may still improve service capacity or reduce risk. The board level question is whether the achieved outcome matches the original investment thesis.
When AI automation touches blockchain records, tokenized assets, wallets, or regulated transaction systems, productivity should never be measured apart from control integrity. The principles in enterprise blockchain architecture for security and scalability are relevant because an apparently efficient workflow that weakens security or auditability can create a much larger downstream liability.
Monitor the System After Launch
AI productivity is not fixed at launch. Models change, knowledge sources become stale, users adapt, policies shift, and exception patterns evolve. A one time pilot report cannot establish durable performance.
Account for Ramp Up and Novelty Effects
Early results may be unusually strong or unusually weak. Teams may concentrate on using the new system because leadership is watching. Conversely, performance may initially decline while users learn escalation rules and process owners refine prompts, routing, and controls.
Fronterio proposes separating baseline capture, an eight to twelve week ramp period, and formal post ramp measurement. That is a vendor recommendation, not a universal standard, but the underlying discipline is sound: avoid declaring success or failure from the first few weeks alone.
The appropriate stabilization period depends on workflow volume and risk. A high volume support workflow may generate enough cases to assess patterns quickly. A low volume legal, security, or finance workflow may require more time because each exception carries more weight.
Create a Monthly Operating Review
A practical review should compare current results with baseline, prior month performance, and target outcomes. It should also separate standard cases from exceptions so the automation does not appear healthy merely because it processes easy work.
Review at least these questions:
• Is quality adjusted throughput improving or declining?
• Are reopened cases, manual corrections, or escalations increasing?
• Has automation shifted work to another team or system queue?
• Are human reviewers spending more time validating AI outputs?
• Is released capacity being converted into measurable business value?
• Have data, policy, security, or model changes altered workflow risk?
Where the data supports it, report ranges or confidence intervals rather than a single productivity percentage. A 12% estimated improvement based on a small sample is less certain than a 7% improvement observed across thousands of comparable cases. The uncertainty should shape the decision: continue testing, expand cautiously, or redesign the workflow.
Key Takeaways
• Measure productivity as quality adjusted output and realized business value, not time saved alone.
• Establish the workflow boundary before deployment, including handoffs, waiting time, exceptions, and downstream rework.
• Use three to six months of historical data where practical, while adjusting for seasonality, workload mix, and staffing changes.
• Separate gross labor time saved from capacity realization. Released hours become ROI only when they create measurable output, service, cost, or risk benefits.
• Use a control group, staggered rollout, or matched comparison when the investment is material and simple before and after results could be misleading.
• Include human review, exception handling, maintenance, monitoring, and remediation in total cost.
• Continue monitoring after launch. AI workflow performance can improve with refinement or deteriorate as inputs, policies, and user behavior change.
Frequently Asked Questions
What Does Productivity Gain Mean in an AI Automated Workflow?
Productivity gain means the workflow produces more acceptable outcomes with the same or fewer resources. It may appear as higher quality adjusted throughput, shorter cycle times, lower cost per completed case, improved SLA attainment, reduced backlog, or productive use of released employee capacity.
Should Productivity Be Measured by Time Saved, Output, or Cost?
Measure all three when possible. Time saved identifies potential capacity. Output shows whether more work was completed. Cost determines whether the benefit is financially realized. Quality and service measures should sit alongside them, because speed without acceptable outcomes is not a sustainable gain.
How Can I Detect Hidden Rework After Automation?
Track reopened cases, correction requests, manual overrides, customer contacts after closure, exception queue volume, and downstream rejection rates. Compare these measures by AI handled and non AI handled cases. A rise in any of them may indicate that the system is shifting work rather than eliminating it.
What Is the Difference Between Automation Rate and Successful Completion Rate?
Automation rate is the share of cases completed by automation under the organization’s stated definition. Successful completion rate adds outcome validation: the case was correct, required evidence was recorded, no material human intervention occurred, and the result did not require reopening or remediation.
How Long Should an AI Workflow Run Before Results Are Evaluated?
There is no universal duration. Evaluate early adoption and safety signals immediately, but wait until users, routing rules, and exception handling stabilize before making broad ROI claims. High volume workflows may stabilize faster than low volume, high risk processes. An eight to twelve week ramp period can be a useful planning reference, but it should not be treated as a fixed standard.
Why Did Throughput Increase Without a Corresponding Cost Reduction?
The organization may have absorbed more demand, reduced backlog, improved service, retained the same fixed staffing level, or increased human review. The right interpretation depends on the investment objective. If the goal was capacity expansion, higher throughput may be a success. If the goal was expense reduction, the operating model may need further redesign.
How Should Human Review Time Be Counted?
Count it as part of the AI enabled workflow cost. Include reviewer time, exception routing, quality assurance, prompt maintenance, knowledge base updates, monitoring, and remediation. Excluding this work produces an incomplete cost per transaction and can overstate ROI.
Which Metrics Work Best for Customer Support, IT, and Finance Workflows?
Customer support commonly uses first contact resolution, reopen rate, customer wait time, containment, and SLA attainment. IT teams often track resolution time, escalation, incident recurrence, and service restoration. Finance teams usually need cost per transaction, exception rate, approval cycle time, audit completeness, and correction rate. The common requirement is the same: pair output and speed with quality and full cost.
Sources And References
• Moveworks — Unlocking Agentic AI ROI for the Modern Enterprise: https://www.moveworks.com/us/en/resources/blog/how-to-measure-and-communicate-agentic-ai-roi
• Moveworks — How Agentic AI Drives Measurable Productivity Gains for IT Teams: https://www.moveworks.com/us/en/resources/blog/how-agentic-ai-drives-productivity-in-it-teams
• Larridin — AI Workflow Productivity Measurement Guide: https://larridin.com/blog/ai-workflow-productivity-measurement-guide?hs_amp=true
• Fronterio — Measuring AI Productivity Gains: A CFO-Ready Framework for…: https://fronterio.com/en/blog/how-to-measure-ai-productivity-gains-cfo-framework
NFT Demon Holdings helps enterprises scope, evaluate, and build blockchain programs — start with a free evaluation call.
Talk through your use case
Free evaluation call — objective, constraints, and fit, before any proposal.