Predicting gas price fluctuations without false precision
By Jeremy Ryan, Founder & CEO · October 2026
Predicting gas price fluctuations starts with a basic distinction that many forecasts miss: motor gasoline and natural gas are separate markets with different drivers, data sources, and forecast horizons. A retail gasoline forecast asks what consumers may pay at the pump. A natural gas forecast estimates movements in commodity benchmarks such as Henry Hub or TTF. Treating them as the same problem produces confident looking forecasts with weak decision value.
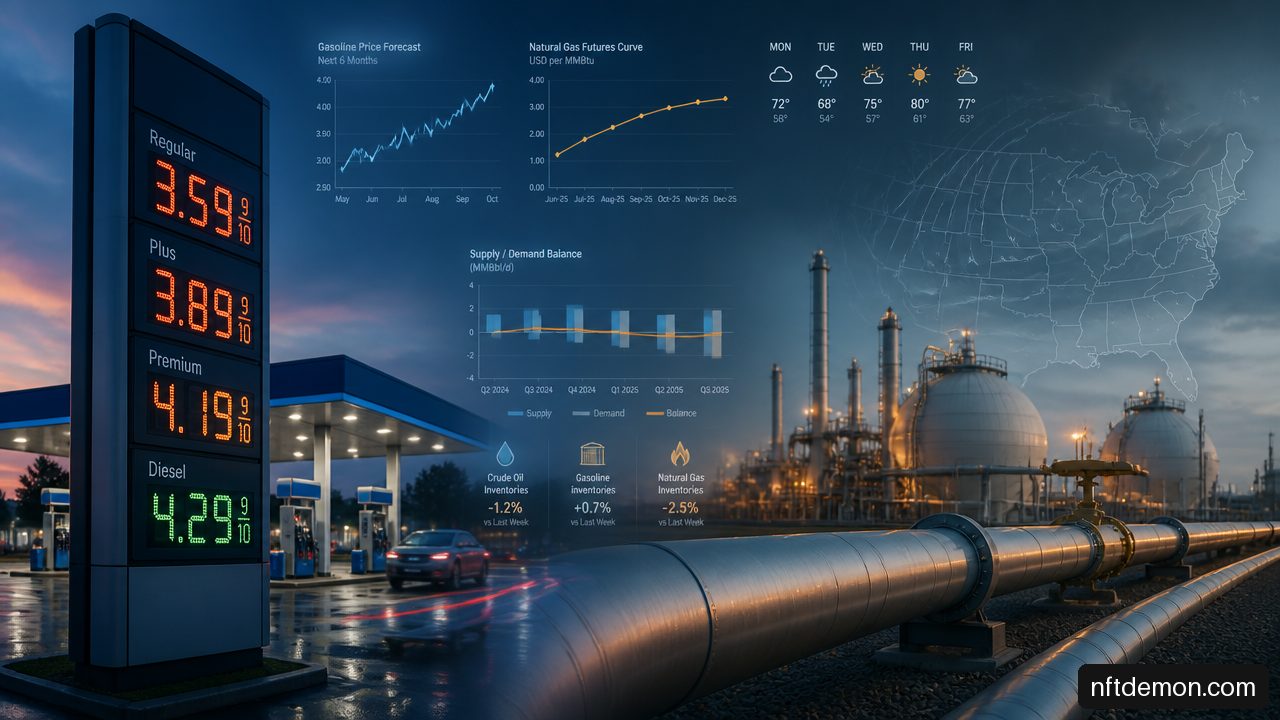
For decision makers, the goal is not to produce a single magical number. I recommend building a forecast that answers three operational questions: what is the most likely direction, what range is plausible, and what events could invalidate the model.
Market And Forecast Design
• Separate Gasoline From Natural Gas
• Choose The Horizon Before The Model
Building And Governing Forecasts
• Use Drivers That Match The Market
• Validate For Real Market Conditions
Practical Decisions
Define The Market And The Forecast Horizon
Separate Gasoline From Natural Gas
Gasoline is a refined retail product. Natural gas is a commodity fuel with regional pipeline, storage, weather, and power market dynamics. Both can move sharply, but their price formation mechanisms are not interchangeable.
Retail gasoline generally reflects a chain of costs: crude oil, refining, wholesale distribution, taxes, retail margins, local competition, and required fuel formulations. Crude oil is usually the largest shared input, but it is not a direct substitute for a local pump price forecast. A refinery outage, a regional supply disruption, or a state tax change can alter retail prices even when crude oil is stable.
The U.S. Energy Information Administration’s gasoline sampling methodology explains that its estimates are built from sampled retail outlets and volume weighted into national, regional, state, and selected city averages. That matters. A model trained on an EIA state average predicts an aggregate, sales weighted measure. It does not predict every station on a commuter’s route.
Natural gas forecasting begins elsewhere. Henry Hub is the principal U.S. benchmark, while TTF is a major European benchmark. Price formation depends heavily on storage, production, pipeline constraints, liquefied natural gas flows, electricity demand, and temperature driven heating or cooling needs. A cold winter forecast can increase expected demand, but the price response still depends on storage adequacy and deliverability.
| Forecast Target | Primary Price Formation | Useful Leading Signals | Common Forecasting Mistake |
|---|---|---|---|
| Local retail gasoline | Wholesale fuel costs, taxes, logistics, station competition | Crude oil, wholesale gasoline, refinery status, local taxes | Applying a national average directly to one station |
| State or regional gasoline average | Crude oil, refining capacity, regional supply and demand | Wholesale rack prices, inventories, seasonal demand | Ignoring volume weighting and formulation differences |
| Henry Hub natural gas | Weather, storage, production, power demand, pipeline capacity | Temperature forecasts, storage data, power prices | Assuming oil prices alone determine the market |
| TTF natural gas | European storage, imports, weather, industrial demand | LNG flows, storage, electricity demand | Reusing a U.S. model without regional variables |
The distinction has a practical implication: organizations integrating commodity signals into enterprise planning should separate benchmarks, local price layers, and business exposure. The same principle applies to blockchain integration architecture for ERP and CRM systems, where data lineage and system boundaries determine whether an analytical output can support an actual decision.
Choose The Horizon Before The Model
Forecast horizon is not a reporting detail. It is a model selection variable.
A same day or next day forecast relies heavily on current spot pricing, futures market signals, known supply interruptions, and near term weather. A one to four week forecast needs scheduled refinery maintenance, holiday travel effects, inventory trends, and expected crude movements. Seasonal or annual planning requires scenarios rather than a narrow point estimate because policy, geopolitics, and macroeconomic conditions can shift the market structure.
| Horizon | Best Decision Use | Typical Inputs | Suitable Starting Method |
|---|---|---|---|
| Hours to days | Dispatching, retail purchase timing, trading controls | Current prices, weather, outages, futures | Latest price baseline, short term regression, time series model |
| One to four weeks | Fleet fuel budgeting, inventory purchases | Wholesale prices, inventories, maintenance, holiday effects | Dynamic regression, ensemble forecast, scenario bands |
| Months to seasons | Procurement strategy, hedging policy, capital planning | Supply outlooks, weather distributions, policy assumptions | Scenario analysis, structural models, stress tests |
| One year or longer | Strategic planning | Macro conditions, infrastructure, policy, demand cases | Ranges and contingencies, not precise price targets |
A model that performs well over four days should not be marketed as a monthly forecast. The 2025 PLOS ONE study of daily Henry Hub prices compared four AI methods using data from 1997 through 2024 over one to four day horizons. Its design is useful evidence for short term natural gas modeling, not proof that the same approach can reliably project a season ahead.
A forecast should be judged by the decision horizon it serves, not by how sophisticated its algorithm sounds.
Build A Forecast That Matches Market Mechanics
Use Drivers That Match The Market
For retail gasoline, I would model the problem in two layers. First forecast the benchmark movement: crude oil and, where available, wholesale gasoline. Then estimate pass through into the geography being forecast. The second layer is where taxes, refinery configurations, distribution costs, local competition, and fuel specifications belong.
This approach improves diagnosis. If the benchmark forecast is correct but a city level estimate fails, the problem is likely local pass through rather than the crude oil signal. Conversely, if several regional forecasts fail simultaneously, the benchmark model or a market regime assumption may be wrong.
A reasonable gasoline feature set can include:
• Crude oil spot and futures prices
• Wholesale gasoline or rack prices
• Refinery utilization, maintenance notices, and outage indicators
• Inventory levels and seasonal demand proxies
• State and local tax changes
• Geographic supply constraints and transport disruptions
For natural gas, weather deserves more than a generic mention. Temperature affects residential and commercial heating demand during cold periods, while hot weather can increase gas fired electricity generation for air conditioning. The relevant measure is not simply the temperature in one city. It is population weighted temperature anomalies across demand regions, combined with expected generation conditions and storage levels.
A nonlinear natural gas forecasting study identified crude oil, temperature, and electricity prices as important predictors while comparing a neural model with random walk and linear benchmarks. That comparison matters because complex models should earn their operational cost by beating simple alternatives on future data.
Uncertainty measures can also contain useful information. A study of natural gas volatility under uncertainty reported predictive value from economic policy uncertainty and oil supply demand uncertainty indicators. These are not guarantees of direction. They are signals that market participants may be repricing risk, which can widen forecast ranges even when the central estimate changes little.
Compare Baselines Before Adding AI
A random walk forecast assumes the latest observed price is the best near term estimate. It is deliberately simple, and that is its value. If an LSTM, random forest, or support vector machine cannot consistently improve on it after costs and complexity are considered, the advanced model has not earned deployment.
I recommend a staged evaluation:
Establish a latest price baseline and a seasonal baseline.
Add transparent regression features tied to market mechanics.
Test nonlinear models only after the simpler models are stable.
Compare errors by geography, horizon, and market condition.
Retain the simplest model that delivers a meaningful decision improvement.
The PLOS ONE research also compared feedforward neural networks, support vector machines, random forests, and LSTM models on its short horizon Henry Hub task. Its reported one to four day Henry Hub evaluation is a reminder that a model result is inseparable from its data period and forecast window. Note that the encoded link is provided exactly as published in the cited source listing.
A practical decision rule is straightforward. Choose a more complex model when it improves out of sample accuracy, remains understandable enough to govern, and changes an action such as hedge timing, inventory levels, or fleet purchase scheduling. Avoid it when its apparent advantage disappears during stressed periods or cannot be explained to the accountable business owner.
Validate, Monitor, And Communicate Uncertainty
Prevent Leakage And Test Market Regimes
Time series validation must respect time. Randomly splitting historical rows into training and test sets can leak future patterns into the model. A model may effectively learn from information that would not have existed at the original forecast date.
Use rolling or expanding windows instead. Train on data available through a defined cutoff date, forecast the next period, record the error, move the cutoff forward, and repeat. This simulates actual operations.
For example, a fleet manager may need a weekly forecast every Monday. The appropriate evaluation creates historical Monday cutoffs, uses only data known by each Monday, and measures the accuracy for that week’s purchasing window. A model tested this way may be less impressive than one evaluated with a random split. It is also far more credible.
Structural breaks require separate attention. A war, major sanctions change, refinery shutdown, pipeline disruption, extreme weather event, or abrupt policy shift can change relationships that looked stable in the training history. Historical correlations may still exist, but their timing and magnitude can change.
When a break is suspected, I would:
• Flag the event rather than silently treating it as ordinary noise.
• Widen intervals and reduce reliance on long run coefficients.
• Run shock scenarios based on alternative supply, demand, and logistics assumptions.
• Retrain after enough post event observations exist.
• Report pre event and post event performance separately.
This is where technology governance meets economic analysis. Teams considering blockchain platform selection for financial institutions should apply the same discipline to data provenance, access controls, auditability, and model decision rights when market data informs high consequence financial actions.
Use Ranges, Thresholds, And Decision Rules
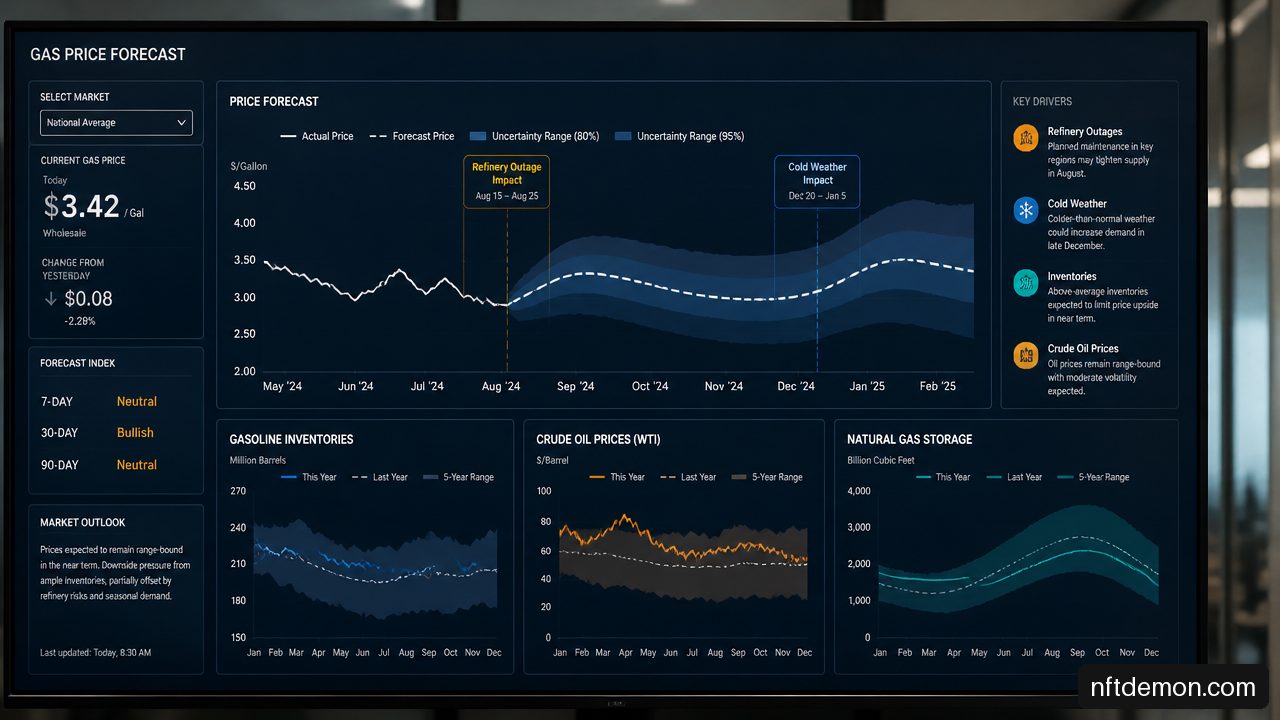
A point forecast such as “gasoline will be $3.42 per gallon next week” is easy to repeat and easy to misuse. A more decision ready forecast states a central estimate, an uncertainty range, and threshold probabilities.
Consider a regional gasoline estimate of $3.42, with a plausible range of $3.30 to $3.58. A fleet does not necessarily need to know the exact future average. It may need the probability that prices exceed $3.50 before a procurement date. A retailer may need to know whether a wholesale jump is large enough to justify a pricing review.
| Stakeholder | Useful Forecast Output | Error That Matters Most |
|---|---|---|
| Consumer | Local price range over several days | Missing a nearby short lived price increase |
| Fleet manager | Weekly range and threshold risk | Underbudgeting fuel expenses during a spike |
| Energy trader | Distribution, volatility, event scenarios | Underestimating tail risk and position exposure |
| Policymaker | Regional scenarios and supply constraints | Misreading a local shortage as a national condition |
| Finance executive | Budget cases and hedge triggers | Treating a point forecast as a commitment |
Forecast reporting should also show whether error grows with horizon. Mean absolute percentage error and mean squared prediction error can be useful, but averages can hide the moments that matter. A model may look strong in calm periods and fail precisely during seasonal transitions or supply disruptions. Report performance by normal conditions, price spikes, and each target geography.
This discipline makes model investment easier to defend. It also aligns with the broader question of how executives measure blockchain ROI: the relevant measure is not technical novelty alone, but whether a system improves a measurable operational or financial decision.
Key Takeaways
The Core Forecasting Principles
• Define the product and location first. Retail gasoline, Henry Hub natural gas, and TTF natural gas need different data and models.
• Match inputs to the forecast horizon. Current pricing dominates short horizons, while seasonal planning requires scenario assumptions and broader supply demand analysis.
• Forecast aggregate measures honestly. A volume weighted state average is not a promise about any individual station.
• Benchmark advanced models against simple alternatives. A random walk or seasonal baseline is often the right test of whether complexity adds value.
The Governance Principles
• Use leakage safe rolling validation. Historical accuracy only matters when the test replicates the information available at the time.
• Publish ranges and threshold probabilities. Decision makers need exposure boundaries, not false precision.
• Treat shocks as regime changes. Retrain, stress test, and separate post shock performance from normal period metrics.
• Connect forecasts to actions. The forecast should inform a purchase, hedge, budget, inventory, or risk decision with a defined owner.
Frequently Asked Questions
What Does Predicting Gas Price Fluctuations Mean?
It means estimating future movement in a gasoline retail price, wholesale fuel price, or natural gas benchmark using available market information. A reliable forecast specifies the product, geography, horizon, and uncertainty range rather than referring vaguely to “gas prices.”
Should Gasoline And Natural Gas Use Different Forecast Models?
Yes. Gasoline models should account for crude oil, refining, distribution, taxes, and local retail pass through. Natural gas models should emphasize weather, storage, production, pipeline capacity, power demand, and regional benchmark conditions. Some signals overlap, but the economic mechanisms differ.
Can Gas Prices Be Predicted Accurately One Week Ahead?
A one week forecast can be useful, especially when it is tied to current wholesale conditions and known events. It should still be treated as a range. Accuracy declines when an unexpected outage, geopolitical event, or weather shift changes supply demand expectations.
Are LSTM Models Better Than Regression Or Random Walk Forecasts?
Not automatically. LSTM models can capture complex sequential patterns, but they require sufficient data, careful tuning, and disciplined validation. A simpler regression or random walk model may be preferable when it has comparable out of sample performance, lower maintenance cost, and clearer business interpretation.
Why Can A National Gasoline Forecast Fail For A Specific City?
National estimates aggregate sampled outlets and sales volumes. A city can diverge because of regional refinery supply, fuel specifications, tax policy, delivery costs, or local competition. Use a national forecast as a benchmark, then add a local pass through layer.
How Should A Forecast Handle Weather And Holidays?
For natural gas, use geographically relevant temperature forecasts and demand patterns rather than one generic weather input. For gasoline, include holiday travel periods, driving season effects, and refinery maintenance schedules. The feature should be tied to a mechanism, not added merely because it is seasonal.
Is A Point Prediction Or A Prediction Interval More Useful?
For most decisions, the interval is more useful. A point estimate suggests a central expectation, while an interval expresses the plausible spread. Threshold probabilities are often better still because they connect directly to a budget, hedge, or purchasing trigger.
Sources And References
• U.S. Energy Information Administration — Sampling Methodology: https://www.eia.gov/petroleum/gasdiesel/gas_proc-methods.php
• PLOS ONE — Natural gas price prediction based on artificial intelligence models: https://journals.plos.org/plosone/article?id=10.1371/journal.pone.0336582
• National Library of Medicine / PMC — Predicting volatility in natural gas under a cloud of uncertainties: https://pmc.ncbi.nlm.nih.gov/articles/PMC10000575/
• SAGE Journals — Non-Linear, Non-Parametric Natural Gas Price and Volatility Forecasting: https://journals.sagepub.com/doi/10.1177/01956574241277302
• journals.plos.org: https://journals.plos.org/plosone/article%3Fid=10.1371/journal.pone.0336582
NFT Demon Holdings helps enterprises scope, evaluate, and build blockchain programs — start with a free evaluation call.
Talk through your use case
Free evaluation call — objective, constraints, and fit, before any proposal.