GNNs for tracking laundered crypto through obfuscation
By Jeremy Ryan, Founder & CEO · September 2026
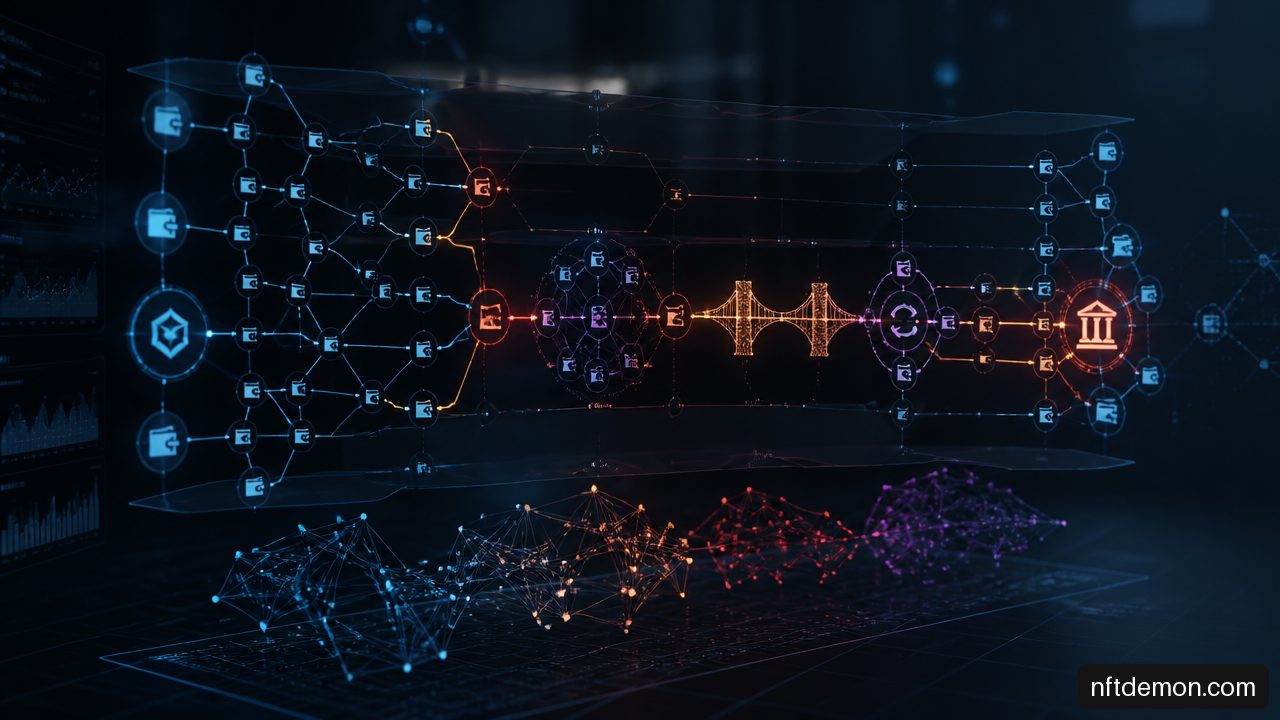
Graph neural networks for tracking laundered cryptocurrency through obfuscation layers give AML teams a way to analyze relationships, not merely isolated transfers. A suspicious transaction rarely proves anything on its own. Its significance often emerges from the sequence around it: rapid fan out, repeated wallet rotation, mixer adjacency, bridge hops, swaps, and eventual conversion at a regulated service.
For decision makers, the practical question is not whether a model can assign a risk score. It is whether the system can prioritize a defensible set of investigations while controlling false positives, adapting to new laundering patterns, and explaining why a particular transaction cluster warrants review.
How GNNs Turn Transaction Flows Into Investigative Signals
A graph neural network, or GNN, is a machine learning model designed for connected data. In cryptocurrency tracing, nodes can represent transactions, addresses, entities, bridge contracts, liquidity pools, or exchange deposit clusters. Edges represent value movements or other meaningful relationships, such as an address interacting with a smart contract.
The core advantage is simple: a GNN learns from a node and its neighborhood. Rather than asking whether one wallet looks unusual by itself, it can ask whether that wallet sits inside a pattern associated with laundering.
The Signal Is In The Neighborhood
A conventional classifier might inspect transaction amount, fee, time of day, balance, or address age. Those features remain useful. But a launderer can make an individual transfer appear routine. What is harder to hide is the structure created by multiple transfers over time.
A GNN passes information between connected nodes. After several message passing layers, a transaction representation can reflect nearby flows, counterparties, timing, asset types, and local topology. In effect, the model can recognize that a transaction is one step downstream from a high risk cluster even if the transaction itself has bland attributes.
Consider a simplified path:
- Funds leave a known high risk cluster.
- The value is split across dozens of fresh addresses.
- Several addresses deposit into a mixer or interact with swap contracts.
- Assets cross a bridge and reappear on another chain.
- Consolidated proceeds arrive at an exchange deposit address.
No single step must be inherently illicit. The sequence and graph shape are what make the chain relevant.
| Graph Component | Useful AML Meaning | Common Feature Examples |
|---|---|---|
| Node | Transaction, address, entity, contract, pool, or bridge endpoint | Amount, age, balance, risk labels, asset type |
| Edge | Transfer or interaction between nodes | Timestamp, value, token, direction, fee, contract call |
| Neighborhood | Local flow context around an event | Fan in, fan out, counterpart diversity, risk proximity |
| Temporal sequence | Order and cadence of activity | Burst intervals, dwell time, repeated routing patterns |
Why Time Changes The Detection Problem
Laundering is a process, not a static graph. A cluster may receive funds, split them within minutes, pause for days, then consolidate them after several swaps. Static models can see connectivity but may miss the operational rhythm.
Temporal GNNs add timestamps or sequential updates so the model can distinguish a dormant address from an address activated immediately after receiving suspicious funds. Research on wavelet and temporal feature fusion for illicit Bitcoin transaction detection shows how wavelet transformed node features and timestamp embeddings can be combined in a GNN. The broader implication is important: both timing and transaction frequency can carry signal when laundering behavior is bursty or deliberately paced.
We should not assume that faster movement always means criminal activity. Market makers, merchants, gaming platforms, treasury systems, and exchange hot wallets can produce intense transaction activity. Time becomes useful only when interpreted with topology, counterparties, asset behavior, and entity context.
Key Takeaways
• GNNs are most valuable when transaction risk depends on relationships among multiple wallets, transactions, or protocols.
• Obfuscation creates graph patterns. It does not erase all structural evidence.
• Temporal features are essential where laundering unfolds through rapid bursts, pauses, or staged consolidation.
• A risk score should support analyst judgment, not replace it.
Modeling Obfuscation Layers Instead Of Isolated Transactions
The strongest systems map laundering methods to explicit graph signals. This moves detection beyond the vague assumption that any interaction with a mixer, bridge, or decentralized finance protocol is suspicious.
Placement, Layering, And Integration Leave Different Traces
The traditional AML stages are useful only when connected to observable behavior. Placement may begin with deposits into service addresses or initial conversions. Layering typically creates the most complex graph structure through splitting, swaps, mixers, and cross chain movement. Integration often appears when funds reconsolidate and reach off ramp points, merchants, custodians, or exchange accounts.
| Obfuscation Pattern | Typical Graph Signal | Modeling Choice | Important Caveat |
|---|---|---|---|
| Peel chain | Repeated sequential transfers with small retained balances | Temporal path features and bounded neighborhood sampling | Legitimate treasury or payout automation can resemble it |
| Mixer or tumbler adjacency | Fan in and fan out, amount fragmentation, timing clusters | Transaction centered subgraphs and motif detection | Use of privacy tools alone is not proof of laundering |
| Chain hopping | Disconnected graph segments joined by bridge evidence | Heterogeneous graph with bridge relations | Cross chain attribution may be incomplete |
| Token swaps | Asset conversion through contracts or pools | Typed nodes and edges for assets and protocols | Routine DeFi trading can generate similar paths |
| Consolidation | Many upstream paths converging before off ramp | Directed flow analysis and entity clustering | Exchange hot wallets naturally consolidate funds |
Mixer Adjacent Features That Matter
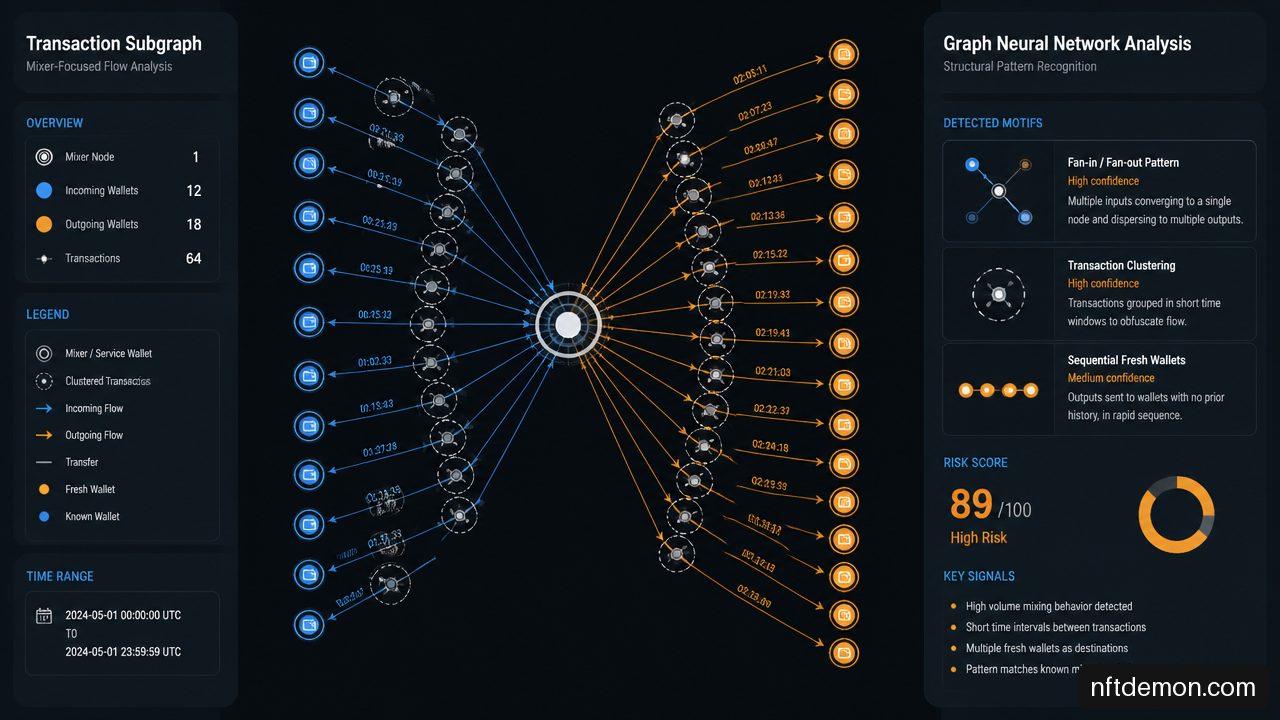
Mixer detection benefits from modeling the local transaction subgraph rather than treating each transfer independently. A useful subgraph can include incoming edges, outgoing edges, nearby counterparties, timestamps, values, denominations, and repeated interaction patterns within a limited radius.
Feature engineering should focus on behavior that is hard to capture in a flat table:
• Burstiness: the degree to which transfers arrive or leave in compressed time windows.
• Fan in and fan out asymmetry: whether many contributors converge into a small set of transactions, or one source disperses value across many destinations.
• Value fragmentation: repeated transfers that divide a balance into unusually regular or strategically varied portions.
• Counterparty novelty: the share of fresh or rarely used counterparties in a local flow.
• Subgraph radius: how many hops to include before unrelated activity overwhelms the signal.
Choosing the radius is a material design decision. One hop may miss a downstream consolidation event. Four or five hops may incorporate a major exchange, a highly connected hub that dilutes the local pattern. A reasonable approach is to test multiple radii and retain the smallest neighborhood that preserves the behavior investigators need to see.
Research on subgraph embedding and contrastive learning for Bitcoin money laundering detection uses transaction subgraph representations and contrastive learning to estimate illicit rates. That approach is relevant because mixers often create suspicious local structures, not merely suspicious individual addresses.
Cross Chain Hops Are A Separate Failure Mode
A bridge does not simply add another edge to a transaction graph. It can break the continuity of identity and value tracking. Source chain assets may be locked, burned, pooled, or deposited into a bridge contract, while destination chain assets are minted or released under a different transaction structure. The original asset may also become wrapped, swapped, or split immediately after arrival.
This creates three distinct modeling problems:
-
Bridge linkage uncertainty: matching a source event to the right destination event may be difficult when bridging is pooled, delayed, or routed through relayers.
-
Semantic change: a native asset, wrapped representation, stablecoin, or liquidity pool token may represent related value but should not be treated as identical without context.
-
Graph boundary loss: a single chain model cannot learn behavior it cannot see. A model trained only on Bitcoin or Ethereum activity will not automatically understand the relevant paths on another chain.
For token based laundering, a heterogeneous graph can be more appropriate than a plain transaction graph because it can distinguish addresses, contracts, tokens, pools, and bridges as different node or edge types. An ACM study of heterogeneous graph analysis for illicit token based activity detection supports this direction. We should choose this added complexity when asset semantics and contract interactions materially affect risk; for a single asset, single chain use case, a simpler temporal transaction graph may be easier to operate and explain.
Building A Reliable Graph Based AML System
A production system needs a data strategy, a labeling policy, and an analyst workflow before it needs a larger neural network. Model selection comes later.
Label Noise Is A Governance Problem
Illicit labels are incomplete by nature. Labels may come from sanctions designations, law enforcement disclosures, confirmed fraud reports, exchange investigations, or public attribution work. Each source has different confidence, timing, and legal meaning.
Treating all labels as equally certain contaminates training. A dormant wallet linked to a historic incident may not have the same evidentiary status as a recently confirmed scam address. Likewise, a wallet interacting once with a suspicious cluster should not automatically inherit an illicit label.
A practical labeling policy separates at least three categories:
• Confirmed: supported by high confidence attribution or formal action.
• Associated: connected to a confirmed cluster through defined graph rules, but not independently confirmed.
• Unknown: not established as licit or illicit and unsuitable as a casual negative label.
This supports weighted learning or positive unlabeled approaches, where the model learns from reliable positives without pretending that every unlabelled transaction is clean. It also gives compliance teams a more defensible basis for reviewing alerts.
Split Data By Time, Not At Random
Random train test splits are a major source of inflated results in blockchain graphs. If transactions from the same future cluster appear in both training and test data, the model can learn patterns it would not have known at the time of an actual investigation.
A safer design trains on an earlier period, validates on a later period, and tests on an even later period. Where possible, teams should also limit overlap in address clusters and entity labels across periods. This is harder and often lowers headline metrics. It is still the more honest estimate of operational performance.
The widely used Elliptic benchmark contains more than 200,000 Bitcoin transactions and roughly 234,000 payment flow relations, making it useful for experimentation. It is not, however, a substitute for current production data or a guarantee that a model will generalize across chains and typologies.
Architecture Selection Should Follow The Investigation
| Decision Need | Better Starting Point | When To Avoid It |
|---|---|---|
| Single chain transaction risk scoring | GCN or graph attention network with temporal features | When asset and contract types carry crucial meaning |
| Mixer adjacent flow detection | Subgraph model with contrastive learning | When local context is too sparse or labels are unavailable |
| Multi token DeFi tracing | Heterogeneous GNN | When graph construction cannot reliably classify node and edge types |
| Fast moving sequential activity | Temporal or recurrent GNN | When timestamps are unreliable or delayed |
| Analyst facing casework | Smaller model with explainability layer | When complexity prevents reproducible evidence trails |
Graph attention networks can be useful where a few neighbors matter more than a large surrounding hub. GCNs remain sensible baselines for connected transaction data. Contrastive learning can help when labels are sparse by teaching the model to distinguish meaningful subgraph structures. There is no universally best architecture because the answer depends on chain coverage, entity resolution, label quality, and the type of laundering under review.
Implementation also has an enterprise dimension. Teams planning case management, data lake, identity, or reporting connections should treat model integration as part of integrating blockchain with existing enterprise systems, not as an afterthought. A high scoring model without alert routing, evidence retention, access controls, and review ownership is not an AML capability.
Evaluating Alerts For Operational Use
A high F1 score can be informative, but it does not tell an executive how many alerts analysts will receive, how often those alerts are defensible, or whether the model is calibrated. Operational evaluation should begin with workload and decision consequences.
Measure What Investigators Actually Face
Precision measures how often alerts are correct. Recall measures how much known suspicious activity is found. Both matter, but they create a trade off. Raising recall may flood investigators with false positives; raising precision may miss emerging typologies.
Use a threshold table before deployment:
| Metric Or Control | Operational Question It Answers | Decision Use |
|---|---|---|
| Precision at k | Of the top k cases, how many are worthwhile? | Staffing and daily queue design |
| Recall on confirmed clusters | How much known risk is surfaced? | Coverage assessment |
| Alert volume | Can the team review this queue? | Capacity planning |
| Calibration | Does a 0.80 score behave like an 80% risk estimate? | Threshold and policy setting |
| Time to alert | How quickly is suspicious activity surfaced? | Intervention and reporting workflow |
| Drift monitoring | Has model behavior changed as typologies evolve? | Retraining decisions |
A model can achieve a strong F1 score while still producing an unusable queue. Suppose 0.5% of transactions are genuinely high risk. Even modest false positive rates can overwhelm a small team when the system processes millions of events. Precision at the top 100 or top 1,000 alerts may tell management more than aggregate F1.
Explain The Subgraph, Not Just The Score
An investigator needs a case narrative: which flows mattered, what sequence occurred, how close the activity is to a known risk source, and what evidence remains uncertain. Feature attribution alone can be misleading because “high fan out” is not a complete explanation.
A useful alert package should include:
• A bounded transaction subgraph with time ordered edges.
• The highest contributing paths or motifs, such as split, swap, bridge, and reconsolidation.
• Relevant entity labels with their confidence level and provenance.
• Plain language reasons for the score, plus model confidence and limitations.
• A reproducible snapshot of the data used at the time of alerting.
This is where false positives become manageable. An analyst may quickly identify an exchange rebalance, a payroll system, or a legitimate DeFi liquidation pattern that resembles laundering. The recovery step is not necessarily to remove the alert rule. It may be to add entity context, retrain with reviewed outcomes, or narrow the subgraph definition.
For executives assessing investment, measuring blockchain ROI should include reduced review time, earlier escalation, confirmed case yield, and defensible audit evidence, not just model accuracy. Architecture choices also depend on data governance: choosing between public and permissioned blockchains affects visibility, data access, and the types of graph relationships available for analysis.
Frequently Asked Questions
What Is A Graph Neural Network For Tracking Laundered Cryptocurrency?
It is a model that learns from linked cryptocurrency activity, including wallets, transactions, contracts, and value flows. It identifies risk using both transaction attributes and surrounding graph structure, which is useful when laundering is spread across many addresses and obfuscation steps.
How Do GNNs Detect Mixers, Tumblers, And Peel Chains?
They can learn recurring local patterns such as rapid fan in, fan out, repeated transfer chains, fragmentation, timing bursts, and reconsolidation. Detection should focus on a combination of signals. Interaction with a mixer or privacy enhancing service alone should not be treated as conclusive evidence of illicit intent.
Can GNNs Follow Cross Chain Laundering?
They can support cross chain tracing when data sources establish credible bridge and asset relationships. They cannot reliably infer missing links. Bridge pooling, wrapped assets, token swaps, and incomplete attribution can create uncertainty that needs to remain visible to investigators.
Which Features Matter Most For Crypto Laundering Detection?
Useful features include transaction timing, amount patterns, address age, counterparty diversity, graph degree, risk proximity, asset type, contract interaction, fan in, fan out, and local subgraph motifs. The best feature set depends on the specific chain and typology.
How Should Teams Handle Incomplete Illicit Labels?
Separate confirmed, associated, and unknown labels. Avoid treating every unlabeled transaction as legitimate. Use label confidence in training and preserve provenance so analysts know whether a model learned from a formal designation, a cluster association, or weaker intelligence.
Are GNNs Better Than Random Forests Or Gradient Boosting?
Not automatically. Tree based models can be effective when strong engineered features are available and explainability is the priority. GNNs are more compelling when linked behavior, multi hop relationships, and changing subgraphs carry material signal. A baseline comparison on time separated data is essential.
What Metrics Matter Beyond F1?
Use precision at k, recall on known cases, calibration, alert volume, time to alert, analyst disposition rates, and drift measures. These metrics tie model behavior to staffing, regulatory reporting, and investigation quality.
Sources And References
• PubMed Central — Detecting illicit transactions in bitcoin: a wavelet-temporal graph neural network. https://pmc.ncbi.nlm.nih.gov/articles/PMC12800192/
• PubMed Central — Bitcoin Money Laundering Detection via Subgraph Embedding and Contrastive Learning. https://pmc.ncbi.nlm.nih.gov/articles/PMC10969714/
• ACM — On the Use of Heterogeneous Graph Neural Networks for Detecting Malicious Activities: a Case Study with Cryptocurrencies. https://dl.acm.org/doi/pdf/10.1145/3677117.3685009
NFT Demon Holdings helps enterprises scope, evaluate, and build blockchain programs — start with a free evaluation call.
Talk through your use case
Free evaluation call — objective, constraints, and fit, before any proposal.