Forecasting blockchain transaction volume with decision grade models
By Jeremy Ryan, Founder & CEO · October 2026
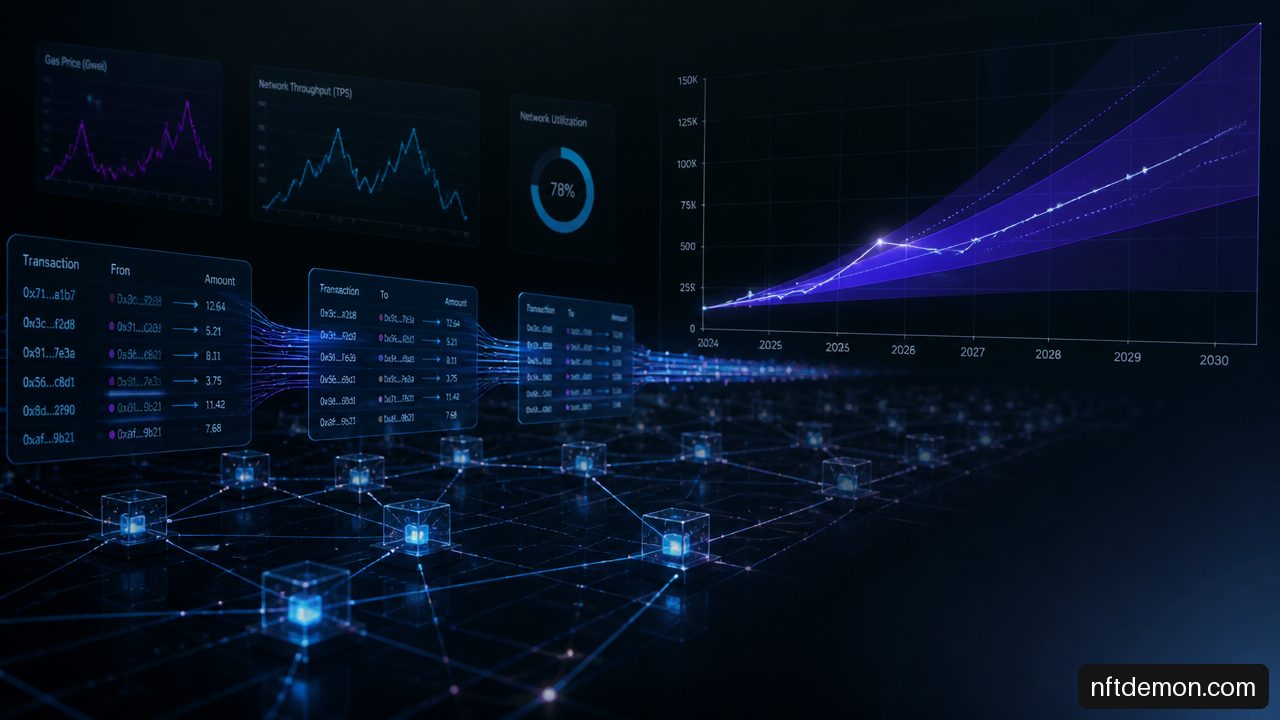
Forecasting blockchain transaction volume is not primarily a model-selection exercise. It is a measurement and decision-design exercise. A forecast can be mathematically accurate yet operationally useless if it mixes transaction count with transferred value, treats congestion as demand, or ignores a known incentive campaign.
For decision makers, the practical goal is straightforward: estimate likely network activity, quantify uncertainty, and know which conditions would invalidate the estimate. I recommend building forecasts that distinguish what users want to do from what the chain can actually process.
- Define The Forecast Target Before Selecting A Model
- Build A Reorg-Aware And Event-Aware Data Foundation
- Select Models Through Realistic Backtesting
- Turn Forecasts Into Capacity And Operating Decisions
- Key Takeaways
- Frequently Asked Questions
- Sources And References
Define The Forecast Target Before Selecting A Model
Transaction Volume Is Not One Metric
The phrase “transaction volume” can mean several different things. Those measures may move together during calm periods, then diverge sharply during a market shock, token launch, NFT mint, or decentralized finance liquidation event. A transaction-count forecast alone may therefore understate computational demand, while a transferred-value forecast may be dominated by a small number of large transfers.
| Forecast Target | What It Measures | Best Use | Main Limitation |
|---|---|---|---|
| Transaction count | Confirmed transactions in an interval | Blockspace demand and operational activity | A low-value bot transaction counts the same as a large settlement |
| Native or token value transferred | Asset quantity moved | Treasury, settlement, and liquidity analysis | Can be distorted by token price and whale transfers |
| Fiat-denominated value | Dollar value transferred | Business reporting and economic sizing | Mixes on-chain behavior with market-price changes |
| Gas used or compute consumed | Computational workload | Fee planning and scalability analysis | Comparable only within a defined execution environment |
| Economically adjusted activity | Filtered user and application activity | Adoption and product planning | Requires assumptions about bots and protocol-generated actions |
A useful approach is to forecast at least two targets: observed throughput and estimated economic demand. Observed throughput is what reached the canonical chain. Economic demand is the activity users or automated systems attempted to submit, including transactions delayed or priced out during network congestion.
Consider an Ethereum-compatible network with a near-full block gas limit. Confirmed transaction count may remain flat for a week even as pending transactions and gas prices rise. The flat count does not prove demand is flat. It may show that the network has reached capacity. Treating this capped series as unconstrained demand can lead a planning team to underinvest in throughput, sequencing, or fee-management controls.
Decision rule: Use transaction count for operational throughput, gas used for execution capacity, and economically adjusted activity for adoption claims. Do not substitute one for another without stating the reason.
Forecast At The Level Where Decisions Occur
A chain-level forecast is useful for broad infrastructure planning, but it is often too coarse for product, security, or revenue decisions. A protocol team may need forecasts by smart contract, application, transaction type, user cohort, or geography where data availability permits.
For example, a chain can show stable total activity while one lending protocol doubles its liquidations and another application loses active users. Aggregation hides the shift. I would structure the data in a hierarchy:
• Chain total
• Application and contract family
• Transaction class, such as swaps, transfers, mints, bridges, or liquidations
• User segment, such as new, returning, institutional, or automated addresses
This supports hierarchical reconciliation: forecasts at lower levels are adjusted so that they add up consistently to the chain total. The method is especially useful when executives need one network view while product and infrastructure teams need a more granular operating view.
Separate Demand From Mechanical Activity
Not every on-chain transaction represents a distinct human or business decision. Bots may rebalance liquidity, search for arbitrage, submit repeated failed attempts, or respond to incentive rules. Contracts can also generate mechanical transaction patterns. These actions may be economically meaningful, but they should not automatically be labeled organic adoption.
There is no universal, verified classification rule for bot or spam activity across all chains. A defensible approach is to maintain parallel series rather than pretend certainty:
• Raw activity: Every qualifying confirmed transaction.
• Filtered activity: Transactions excluded by transparent heuristics, such as repeated low-value patterns, known system addresses, or contract-specific mechanical flows.
• Attributed activity: Transactions grouped by application, contract, or suspected automation category.
The PeerJ survey of neural-network methods for predicting token prices describes parsing ledger records into transaction categories and extracting features such as active addresses, transfer size, validator activity, exchange flows, and fee metrics. That parsing layer matters because the forecasting model can only be as coherent as the target series it receives.
Build A Reorg-Aware And Event-Aware Data Foundation
Treat Ledger Data As A Production Dataset
Blockchain data appears immutable only after sufficient finality. Recent blocks can be reorganized, indexers can lag, internal calls can be counted differently across providers, and duplicate records can enter a pipeline after retries or backfills. These are data-engineering issues, not minor implementation details.
A robust pipeline should preserve raw block and transaction identifiers, mark provisional observations, and only promote data to a final training table after the chosen finality threshold. The threshold depends on the chain and risk tolerance. A short-horizon operational forecast may need near-real-time provisional data; a board report usually benefits from finalized data.
A practical quality-control sequence is:
- Ingest raw chain, mempool, market, and protocol-event data with source timestamps.
- Deduplicate by chain identifier and transaction hash, while documenting how replacements and internal calls are handled.
- Detect missing blocks, abnormal timestamp gaps, and indexer backfills.
- Reconcile aggregates against an independent explorer or node query where feasible.
- Freeze finalized historical partitions, while retaining a correction log for reorgs and late-arriving records.
Fair warning: mixing a real-time dashboard series with a finalized historical series can create a misleading model improvement. The model may appear to predict volume when it is actually learning the timing of data corrections.
Add Known Events As Interventions
Protocol upgrades, airdrops, exchange listings, fee changes, outages, and incentive campaigns can overwhelm ordinary weekly or monthly patterns. A model that treats these changes as random noise will either overreact after the event or miss the effect entirely.
Use an event table with a timestamp, expected duration, affected applications, event type, and known status at forecast time. An intervention variable can be binary, scaled by campaign budget, or modeled as a temporary decay curve. The key question is not whether an event happened; it is whether it was knowable before the prediction date.
For example, if a token incentive program begins on Monday and was publicly announced two weeks earlier, it can be included in a Monday forecast. If the model is evaluated using the completed campaign outcome as a feature, that is leakage.
The Taylor & Francis study of Ethereum NFT market activity supports using ARIMA, machine-learning regressors, and SHAP feature attribution for Ethereum NFT transaction-volume forecasting. That combination is valuable because an event-heavy market needs both a time-series baseline and an interpretable view of which explanatory variables changed the prediction.
Build Features That Explain Mechanisms
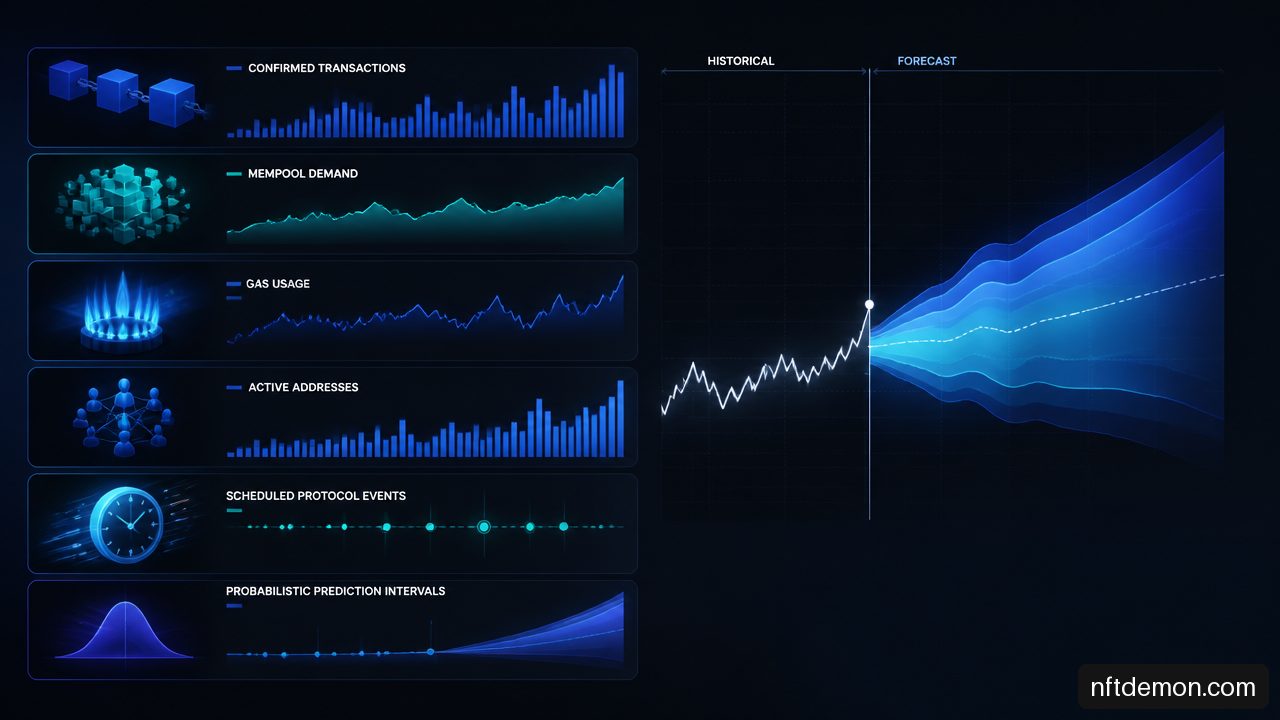
Features should represent a plausible mechanism, not simply correlate with the target in one historical period. Fees may influence transaction inclusion and user behavior. Active addresses may indicate participation breadth. Mempool observations can provide near-term leading signals, although they are node-dependent and incomplete.
| Feature Group | Examples | Why It May Help | When To Be Careful |
|---|---|---|---|
| On-chain demand | Active addresses, new addresses, contract calls | Captures participation and application use | Address counts can be inflated by automation |
| Network conditions | Gas price, gas used, pending transactions, block fullness | Indicates congestion and capacity pressure | Congestion can suppress confirmed volume |
| Market context | Asset price, realized volatility, exchange flows | Captures trading and sentiment cycles | Correlation may break across regimes |
| Protocol operations | Upgrade dates, incentive windows, outages | Represents known structural changes | Do not use outcomes unavailable at forecast time |
| Application signals | Unique contract callers, bridge deposits, liquidation count | Connects forecasts to specific use cases | Contract migrations can break continuity |
This is also where architecture choices matter. Teams evaluating blockchain latency and throughput should connect those performance metrics to the forecasting target. Latency, finality, and throughput constraints change what “volume growth” means in practice.
Select Models Through Realistic Backtesting
Start With A Baseline That Can Lose
A sophisticated model has no value unless it beats a simple benchmark under realistic conditions. I recommend starting with at least three baselines:
• Last observed interval, or naive persistence
• Seasonal naive, such as the same hour last week or same day last month
• Moving average or exponential smoothing trend
Classical ARIMA, SARIMA, and ETS models remain useful when the series has stable autocorrelation, identifiable seasonality, and limited feature complexity. The Kyiv School of Economics repository analysis of stablecoin transfers provides an example of ARIMA-based stablecoin-transfer-volume forecasting through 2030. That is evidence that classical models can support longer-horizon scenario work, but it does not establish that a single ARIMA specification will generalize across chains or applications.
Use machine-learning models such as gradient boosting or random forests when nonlinear interactions matter: perhaps gas spikes reduce retail transactions only when market volatility is already elevated. Use sequence models such as LSTM or GRU only when enough clean, stable data exists to justify their added complexity. Deep models can be attractive on paper and disappointing in sparse, regime-changing series.
Compare Models By Horizon And Regime
The “best” model is usually horizon-specific. A mempool-driven model may perform well for the next block or next hour. It may add little value for next quarter, where roadmap events, regulation, and market conditions dominate.
Evaluate forecasts with rolling-origin backtests. Train on data available at a past cutoff, predict the next interval, move the cutoff forward, and repeat. This simulates the decisions a team would have faced in real time.
| Decision Context | Typical Horizon | Preferred Evaluation Focus |
|---|---|---|
| Fee and sequencer operations | Minutes to hours | Timeliness, interval coverage, congestion-state error |
| Capacity planning | Days to weeks | Peak error, seasonal stability, event sensitivity |
| Product and budget planning | Months to quarters | Scenario range, directional accuracy, assumption transparency |
Do not rely on mean absolute percentage error when actual counts can be near zero; the denominator can make ordinary misses look extreme. Use MAE or weighted absolute error for counts, and add quantile loss or interval coverage for uncertainty. Review errors separately during normal conditions, congestion, outages, and incentive periods. An average score can conceal a model that fails precisely when operational stakes are highest.
Use Probabilistic Forecasts, Not One Number
A point estimate says, “Tomorrow’s transaction count is 1.2 million.” A decision-grade forecast says, “The central estimate is 1.2 million, with a specified range under current assumptions.” Capacity planners need the second statement.
Prediction intervals can be generated through statistical model distributions, quantile regression, conformal methods, or ensembles. Whatever method is used, test calibration. A nominal 90% interval should contain roughly 90% of realized observations across comparable historical periods. If it only contains 60%, the range is too confident.
The Springer research on temporal mixture ensembles supports multi-source probabilistic forecasting using transaction and order-book data. Its broader lesson is practical: different sources can contribute differently as market conditions change, and uncertainty should be part of the model output rather than an afterthought.
Turn Forecasts Into Capacity And Operating Decisions
Forecast Demand And Throughput Separately
When blockspace or sequencer capacity is constrained, confirmed transactions represent a censored outcome. The observed series is limited by what can clear. A capacity-aware model should therefore track signals such as pending transactions, fee escalation, block fullness, dropped requests, and application-level failure rates alongside confirmations.
Imagine a consumer application expecting a marketing-driven surge. If the forecast predicts 30% more submitted demand but only 5% more confirmed volume because blocks are full, the correct action is not to declare stable demand. The team may need batching, off-chain signing, queue controls, fee sponsorship limits, or a different execution path.
For product leaders designing a blockchain application for transaction volume, the forecast should become an explicit input to service-level objectives, retry policy, user messaging, and cost controls.
Convert Ranges Into Thresholds
A forecast is useful when it triggers a defined action. Establish thresholds before an event, not after a dashboard turns red.
- Define the capacity or risk boundary, such as 80% sustained gas utilization or a target confirmation-time ceiling.
- Map the upper prediction interval to actions, such as increasing infrastructure capacity, throttling noncritical jobs, or activating fee controls.
- Assign an owner and response time for each threshold.
- Record what happened, then compare the observed outcome with the forecast range.
The same logic applies to scalability design. A forecast is not a substitute for architecture; it is a way to test whether the architecture will survive expected demand. Planning for scalability architecture for high throughput should use peak-range scenarios, not only average daily transaction estimates.
Maintain A Forecast Governance Loop
Forecasting systems degrade when their assumptions are not reviewed. A monthly or event-driven review should inspect target definitions, source quality, feature drift, interval calibration, and performance by regime. If an upgrade changes fee mechanics or a contract migration changes transaction semantics, version the series rather than forcing artificial continuity.
The most credible forecast is often conditional: if current fee conditions persist, if the announced campaign launches on schedule, and if no material outage occurs. That is not evasive. It tells decision makers what must remain true for the projection to hold.
Key Takeaways
• Define transaction volume precisely before modeling. Transaction count, transferred value, gas used, and economic activity answer different questions.
• Forecast at the chain, application, and transaction-type levels when decisions require that granularity, then reconcile totals.
• Use reorg-aware, deduplicated, time-consistent data. Data corrections can otherwise masquerade as predictive skill.
• Start with naive and seasonal baselines. Choose added model complexity only when rolling backtests justify it.
• Include known upgrades, incentives, and outages as pre-known interventions rather than burying them in seasonality.
• Plan against prediction intervals and capacity thresholds, not a single average forecast.
Frequently Asked Questions
What Should Blockchain Transaction Volume Mean In A Forecast?
It should mean the metric tied to the decision. Use transaction count for throughput, gas used for compute demand, transferred value for settlement analysis, and filtered activity for adoption analysis. State the unit, aggregation interval, chain scope, and inclusion rules in every forecast.
How Far Ahead Can Blockchain Transaction Volume Be Forecast Reliably?
Reliability declines as the horizon expands. Minutes and hours can benefit from mempool and congestion signals; weeks may retain seasonal and event information; quarters depend heavily on explicit scenarios. There is no universal reliable horizon because liquidity, capacity, protocol changes, and market conditions differ by network.
Is ARIMA Better Than LSTM For Transaction Forecasting?
Neither is inherently better. ARIMA is often preferable when the dataset is modest, interpretable, and structurally stable. LSTM may be considered when there is extensive clean sequential data and evidence of complex temporal dependencies. If an LSTM does not outperform seasonal naive and ARIMA baselines in rolling tests, avoid the extra operational burden.
Which Variables Usually Improve A Transaction-Volume Forecast?
Useful candidates include historical transaction counts, active addresses, gas fees, gas used, pending transactions, application-level calls, exchange flows, token prices, and scheduled protocol events. Keep only variables available at the forecast timestamp and test whether each improves out-of-sample performance.
How Should Airdrops, Incentives, And Upgrades Be Modeled?
Represent them as intervention variables with known start dates, anticipated duration, and affected applications. Evaluate them as events, not ordinary seasonality. If the event was unknown at the time of a historical forecast, do not let the model use the later outcome as an input.
How Can Bot And Spam Activity Be Handled?
Maintain raw and filtered series. Use documented heuristics for known system addresses, repeated mechanical patterns, or protocol-generated flows, but report the rules and uncertainty. Filtering should support a decision purpose, not manufacture a preferred adoption narrative.
What Happens When A Chain Is Capacity-Constrained?
Confirmed volume becomes an incomplete measure of demand. Model submitted or pending demand signals, fee pressure, block fullness, and failure rates alongside confirmations. A flat confirmation count during high congestion may indicate a supply ceiling rather than stable usage.
Sources And References
• Taylor & Francis — Exploring the NFT market on Ethereum: a comprehensive analysis and daily volume forecasting. https://www.tandfonline.com/doi/pdf/10.1080/09540091.2023.2286912
• Springer — Temporal mixture ensemble models for probabilistic forecasting of intraday cryptocurrency volume. https://link.springer.com/article/10.1007/s10203-021-00344-9
• Kyiv School of Economics repository — The impact of blockchain on interbank. https://kse.ua/wp-content/uploads/2025/09/Nazarii_Oryshchuk_THE-IMPACT-OF-BLOCKCHAIN-ON-INTERBANK.pdf
• PeerJ — Survey of neural network methods for predicting token prices. https://peerj.com/articles/cs-3702.pdf
NFT Demon Holdings helps enterprises scope, evaluate, and build blockchain programs — start with a free evaluation call.
Talk through your use case
Free evaluation call — objective, constraints, and fit, before any proposal.